


In this blog we consider the big picture from the CHI 2019 Papers track. We look at what’s been accepted, what hasn’t. We also consider how things went with reviewing and look at some author-level data. We will analyze the effect of rebuttals in this cycle in another blog post.
Overall
This year, 2958 papers were left in the system for review. Of these, 705 have been provisionally accepted for the Papers track at CHI 2019. That is a 23.8% acceptance rate, down from 25.7% last year. Eighty-three of these accepts are being shepherded*. The overall mean score for all submissions, including desk and quick rejects, was 2.52 (SD=0.35).
As in previous years, a significant proportion of papers score between 2.0 and 3.0 (inclusive) – this year more than half (1,494 submissions, 50.5%). Figure 1 shows the distribution of accepts by score. The figure collapses accepted and shepherded papers into ‘A’s and all other decisions (including withdrawal) into ‘R’s. Accepted papers had a mean score of 3.66 (Range 2.38-4.88). This was lower than last year’s mean of 3.73. Forty-two papers with mean scores lower than 3.0 have been accepted (which is precisely double last year’s 21).
The highest-scoring reject had an average of 3.62. There were 117 submissions rejected with a score of ≥3.0 (but only 65 >3.0). There were 224 submissions that scored >2.8 and <3.2. Of these, 70 were accepted. Submissions averaging >3.25 (n=587) were extremely likely to be accepted (97.1%).

Reviews
A total of 2799 external reviewers completed 5433 external reviews (Mdn=1, M=1.94). As you will see in the next section, this means that authors outnumber reviewers just under 3:1. The General Chairs, TPCs and Papers Chairs thank reviewers for this absolutely essential contribution. No reviews means no accepts, no accepts means no conference.
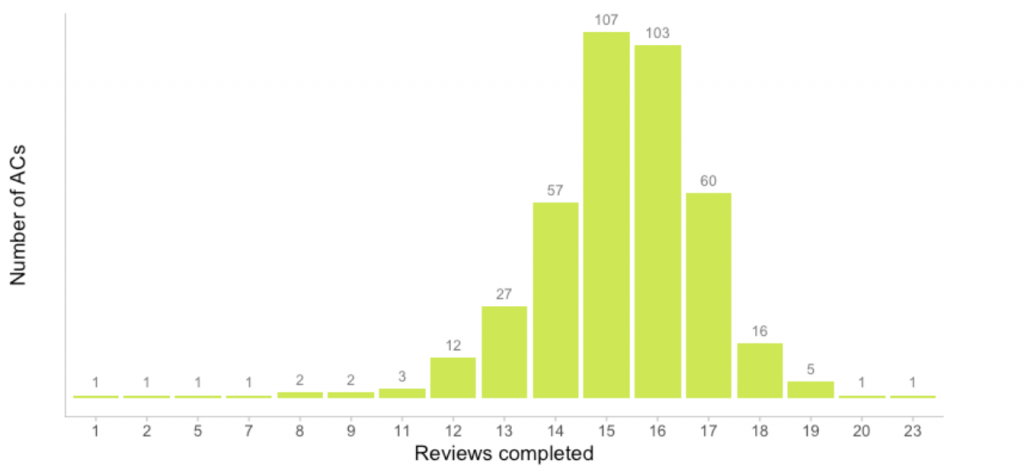
The most reviews completed by an external reviewer was 12. Five or more reviews were completed by 189 reviewers. The distribution of completed reviews by a given reviewer is illustrated in Figure 2.

External reviewers are only half the picture, though. The other half is the extremely dedicated programme committee, whose associate chairs write reviews and meta reviews and who made the decisions over the 7th and 8th of December. The 400 members of the PC produced 6074 reviews (or around 15 each). Just producing the reviews is a gargantuan amount of work. Unfortunately we don’t have a chart that shows the work that goes into finding external reviewers, managing those reviewers, sending reminders, facilitating discussions, attending the PC meeting, writing final post-PC comments, shepherding, checking camera-ready submissions,… it goes on and on. The General Chairs, TPCs and Papers Chairs are extremely grateful to the ACs for their efforts in putting together CHI’s biggest ever programme.
Authors
A total of 8,319 authors were listed on submissions, give or take a few duplicate accounts. The vast majority of authors (6,425, 77%) were involved in one submission. Of these authors, 1,462 (22.8%) had their names on an accepted submission. Being on a large number of submissions is uncommon. Only 265 of those 8,319 authors (3%) made five or more submissions. Only 13 authors (0.15%) have their names attached to five or more accepted papers. We congratulate these authors on their success, but note that the vast majority of authors submit one paper and that submission is not successful. Do not be disheartened if things have not gone as well as you might have hoped. You might consider submitting a revised version of the paper to a different SIGCHI conference, many of which will be issuing calls of submissions soon.
Are people who make more submissions generally more successful with them? Only thirteen authors had three or more accepts without a reject. Two authors had four. Conversely, 45 authors made five or more submissions without any success. Figure 4 helps to make this a little bit clearer. It plots, for each author, how many accepts they had, versus the number of rejects they had. Note, authors with more than four accepts (n=13) are excluded from this plot as the published proceedings may allow for their identity to be determined. Authors with more than 7 rejects (n=25) are also excluded.

*ACs can require changes to papers before the camera-ready submissions are made. A small number of papers are assigned a ‘shepherd’. This is an AC who helps the authors make changes to the manuscript in a way that meets the requirements of the PC and reviewers. It often happens when a paper needs specific changes that are carefully made in order for it to be it accepted.